1st grade graphs and data lessons
Quick answer
This playlist covers 1st grade data: sorting into groups, tally marks, picture graphs and simple bar graphs, and answering questions about how many and how many more. It begins with Learn Bright's "Graphs for Kids" and Scratch Garden's "Data!", then moves to practice. Play all on repeat, or loop one graph to talk it through.
Videos in this playlist
- 1
 Graphs for Kids | Learn all about basic graphsLearn BrightPlay from here Loop
- 2
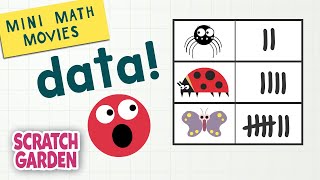 Data! | Mini Math Movies | Scratch GardenScratch GardenPlay from here Loop
- 3
 How To Keep Track With Tally Marks | How To Use Tally Marks | Kids AcademyKids AcademyPlay from here Loop
- 4
 Organizing and Interpreting Data - 1st Grade Math Videos for KidsMath & Learning Videos 4 KidsPlay from here Loop
- 5
 Picture Graph Word Problems - Pictographs | Math for 2nd Grade | Kids AcademyKids AcademyPlay from here Loop
- 6
 Bar Graphs for Kids | Math for 2nd Grade | Kids AcademyKids AcademyPlay from here Loop
- 7
 Understanding picture and bar graphs | 3rd grade math (Illustrative Math-aligned) | Khan AcademyKhan AcademyPlay from here Loop
- 8
 Valentine’s Day Candy Heart Graph WorksheetHave Fun TeachingPlay from here Loop
- 9
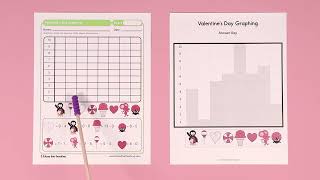 Valentine's Day Graphing WorksheetHave Fun TeachingPlay from here Loop
- 10
 Bar Graphs & Picture Graphs Song | 2nd Grade - 3rd GradeNumberockPlay from here Loop
What do children learn about graphs in 1st grade?
In 1st grade (ages 6–7), children sort data into up to three categories, record it with tally marks, and read picture graphs and simple bar graphs. They answer questions such as how many in total, which has the most, and how many more one group has.
How can RepeatWatch help with graphs?
Pause on a graph, set an A–B loop around the question, and let your child answer before the video does. Slow to 0.75× when a narrator counts tally marks, and save each graph to keys 1–9 so you can return to it.
Frequently asked questions
What should my child be able to do after this unit?
A child should be able to make tally marks, read a picture graph or bar graph with up to three categories, and answer questions about the total, the most and the least, and how many more or fewer.
Some videos say 2nd or 3rd grade. Why are they here?
Picture graphs and bar graphs carry on into 2nd and 3rd grade. The ones included here use small numbers and a scale of one, so they work as practice for 1st graders with a little extra challenge. Grade levels also vary by country and school.