6th grade mean, median, mode and range
Quick answer
In 6th grade (ages 11–12), students learn what makes a question statistical, find the mean, median, mode and range, and read dot plots, histograms and box plots. This playlist starts with Khan Academy and Math Antics, then adds Math with Mr. J. Repeat one worked example with an A–B loop until it sticks.
Videos in this playlist
- 1
 Statistical questions | Data and statistics | 6th grade | Khan AcademyKhan AcademyPlay from here Loop
- 2
 Statistical and non statistical questions | Probability and Statistics | Khan AcademyKhan AcademyPlay from here Loop
- 3
 Numerical data sets | 6th grade math (Illustrative Math-aligned) | Khan AcademyKhan AcademyPlay from here Loop
- 4
 Categorical data sets | 6th grade math (Illustrative Math-aligned) | Khan AcademyKhan AcademyPlay from here Loop
- 5
 Math Antics - Mean, Median and ModemathanticsPlay from here Loop
- 6
 Mean, Median, Mode, and Range | Math with Mr. JMath with Mr. JPlay from here Loop
- 7
 How to Find the Mean, Median, Mode, and RangeMashup MathPlay from here Loop
- 8
 Statistics intro: Mean, median, and mode | Data and statistics | 6th grade | Khan AcademyKhan AcademyPlay from here Loop
- 9
 Mean | Data sets and distribution | 6th grade math (Illustrative Math-aligned) | Khan AcademyKhan AcademyPlay from here Loop
- 10
 Interpreting mean | 6th grade math (Illustrative Math-aligned) | Khan AcademyKhan AcademyPlay from here Loop
- 11
 Median | Data sets and distribution | 6th grade math (Illustrative Math-aligned) | Khan AcademyKhan AcademyPlay from here Loop
- 12
 Finding the range and mid-range | Descriptive statistics | Probability and Statistics | Khan AcademyKhan AcademyPlay from here Loop
- 13
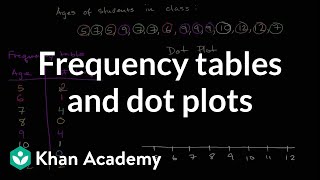 Frequency tables and dot plots | Data and statistics | 6th grade | Khan AcademyKhan AcademyPlay from here Loop
- 14
 Histograms | Applying mathematical reasoning | Pre-Algebra | Khan AcademyKhan AcademyPlay from here Loop
- 15
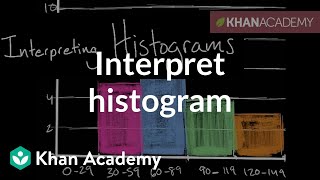 How to interpret a histogram | Data and statistics | 6th grade | Khan AcademyKhan AcademyPlay from here Loop
- 16
 Interpreting variability | 6th grade math (Illustrative Math-aligned) | Khan AcademyKhan AcademyPlay from here Loop
- 17
 Mean absolute deviation | Data and statistics | 6th grade | Khan AcademyKhan AcademyPlay from here Loop
- 18
 Mean absolute deviation example | Data and statistics | 6th grade | Khan AcademyKhan AcademyPlay from here Loop
- 19
 How to calculate interquartile range IQR | Data and statistics | 6th grade | Khan AcademyKhan AcademyPlay from here Loop
- 20
 Box and Whisker Plots Explained | Understanding Box and Whisker Plots (Box Plots) | Math with Mr. JMath with Mr. JPlay from here Loop
- 21
 Interpreting box plots | Data and statistics | 6th grade | Khan AcademyKhan AcademyPlay from here Loop
- 22
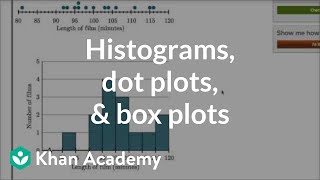 Comparing dot plots, histograms, and box plots | Data and statistics | 6th grade | Khan AcademyKhan AcademyPlay from here Loop
- 23
 Impact on median and mean when removing lowest value example | 6th grade | Khan AcademyKhan AcademyPlay from here Loop
- 24
 Impact on median and mean when increasing highest value | 6th grade | Khan AcademyKhan AcademyPlay from here Loop
- 25
 Median and range puzzle | Data and statistics | 6th grade | Khan AcademyKhan AcademyPlay from here Loop
What should a 6th grader be able to do after this unit?
Tell a statistical question from a non-statistical one, find the mean, median, mode and range of a data set, describe spread with the interquartile range or mean absolute deviation, and read dot plots, histograms and box plots. Grade levels vary by country and school.
How does RepeatWatch help with statistics practice?
Loop the part where the teacher orders the data and finds the middle value, and slow it to 0.75× to follow the adding and dividing for the mean. Save each measure on keys 1–9, and use Stop after N loops to keep sessions short.
Frequently asked questions
What is the difference between mean and median?
The mean adds all the values and divides by how many there are. The median is the middle value once the data is in order. The Khan Academy videos near the end show how one very high or low value changes the mean more than the median.
What are MAD and IQR?
Both describe how spread out data is. Mean absolute deviation is the average distance from the mean, and the interquartile range is the spread of the middle half of the data. Khan Academy covers each with worked examples.